Connecting to the live feed.
As it happens
Real figures from our own work, as it happens. Nothing here is estimated, smoothed or filled in.
Right now
tokens read and written since you opened this page
Counting starts the moment you arrive. The first request usually lands within seconds.
- tokens a minute
- requests in the last hour
- tasks under way
- tasks finished in the last hour
- releases in the last hour
As it lands
Rows appear here as they land.
The numbers
- Tasks completed
- Releases shipped
- Tokens read and written
- The text our work reads and writes, counted the way public price lists count it.
- Compute value
- What this work would cost at public API prices.
- Success rate, last 30 days
- Context reused, last 30 days
- Text read once and used again, which keeps the work fast and the cost low.
- Uptime, last 30 days
Last 24 hours, by product
Quality, week by week
The same four measures of our work, every week for the last three months. Each figure is a share or a median of real tasks; a week with too few tasks shows none.
Work finished on the first attempt, with no retry.
Median time from a code change being asked for to it running in production.
Share of code work that fixes earlier work. Lower is better.
Of the tasks that hit a problem and ran again, the share that then succeeded with no person involved.
Over time
Point at a bar to read it, or focus the chart and use the arrow keys. Times are in UTC.
No history to show yet.
Show as a table
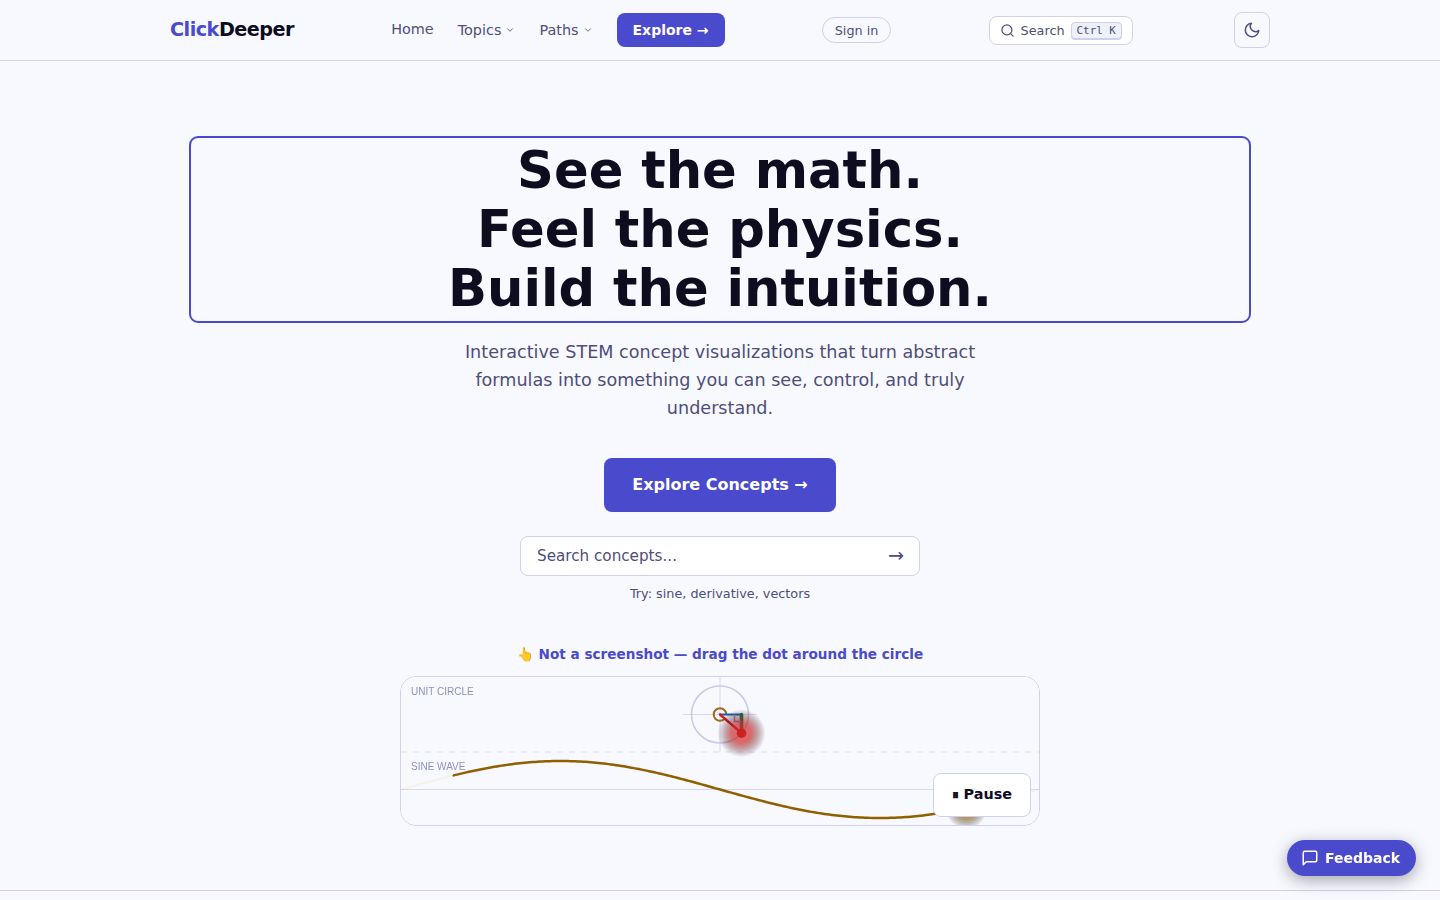
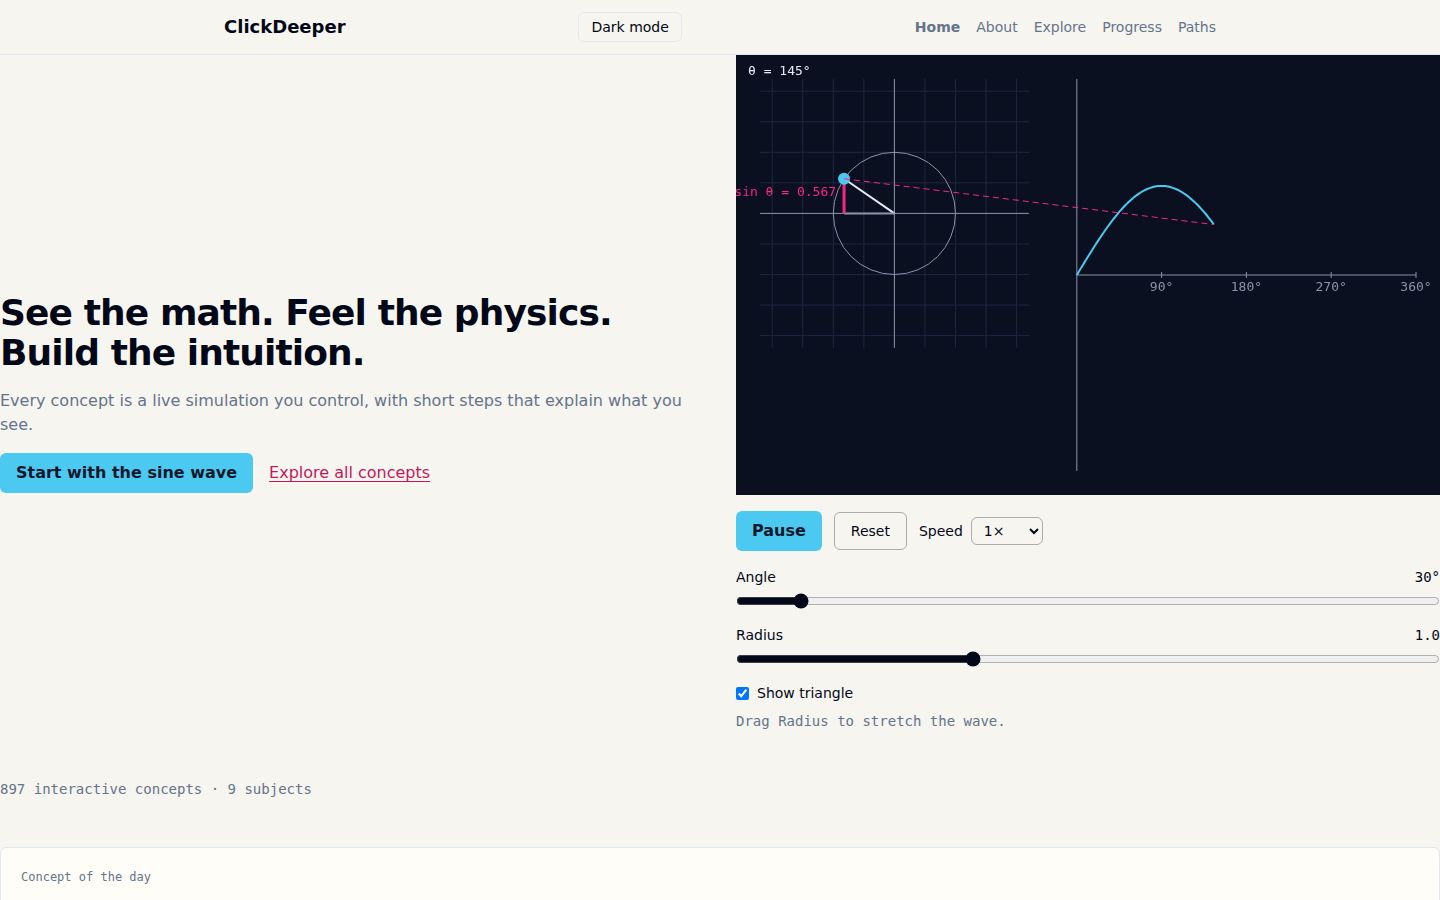
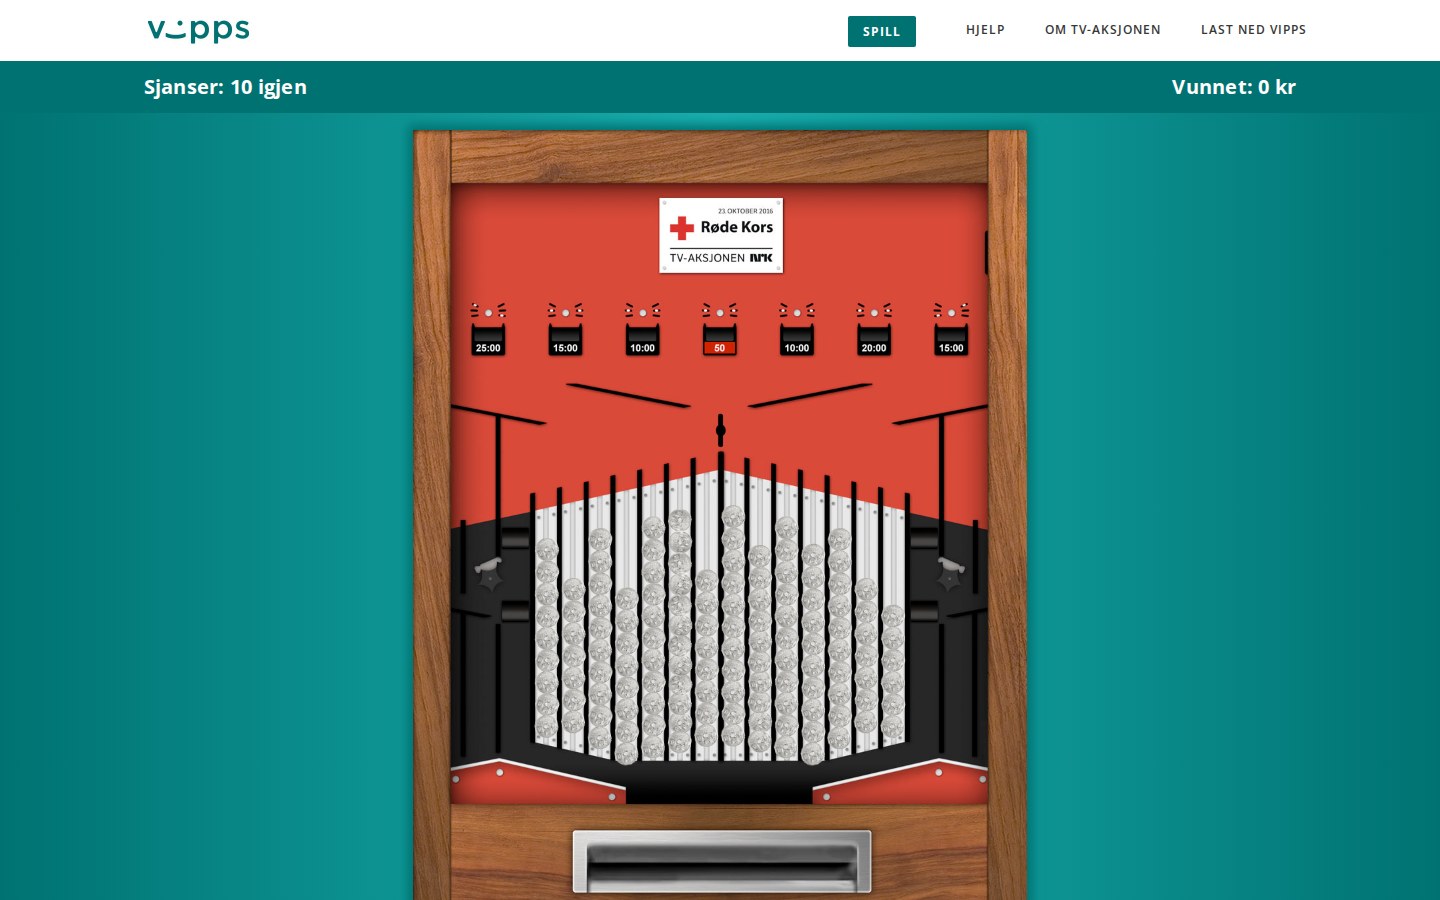
Our products
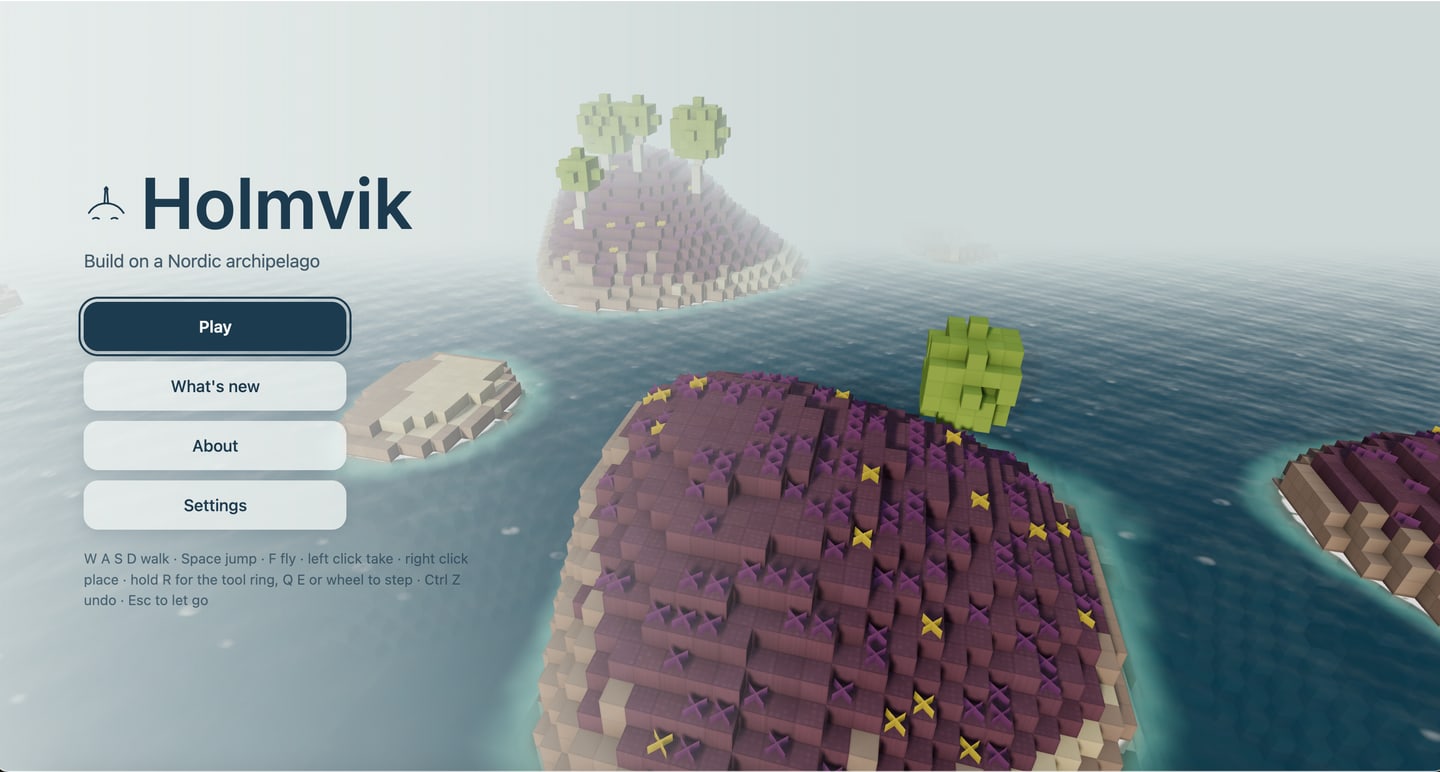
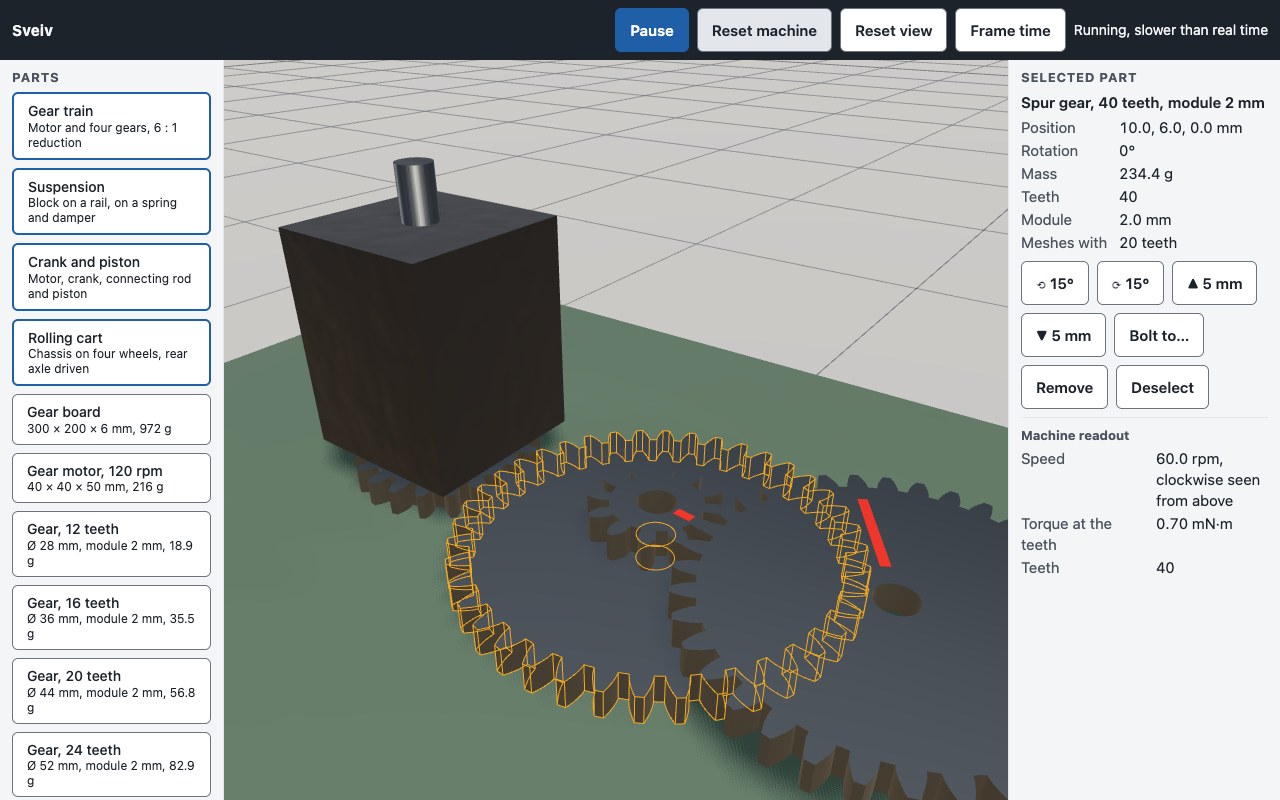
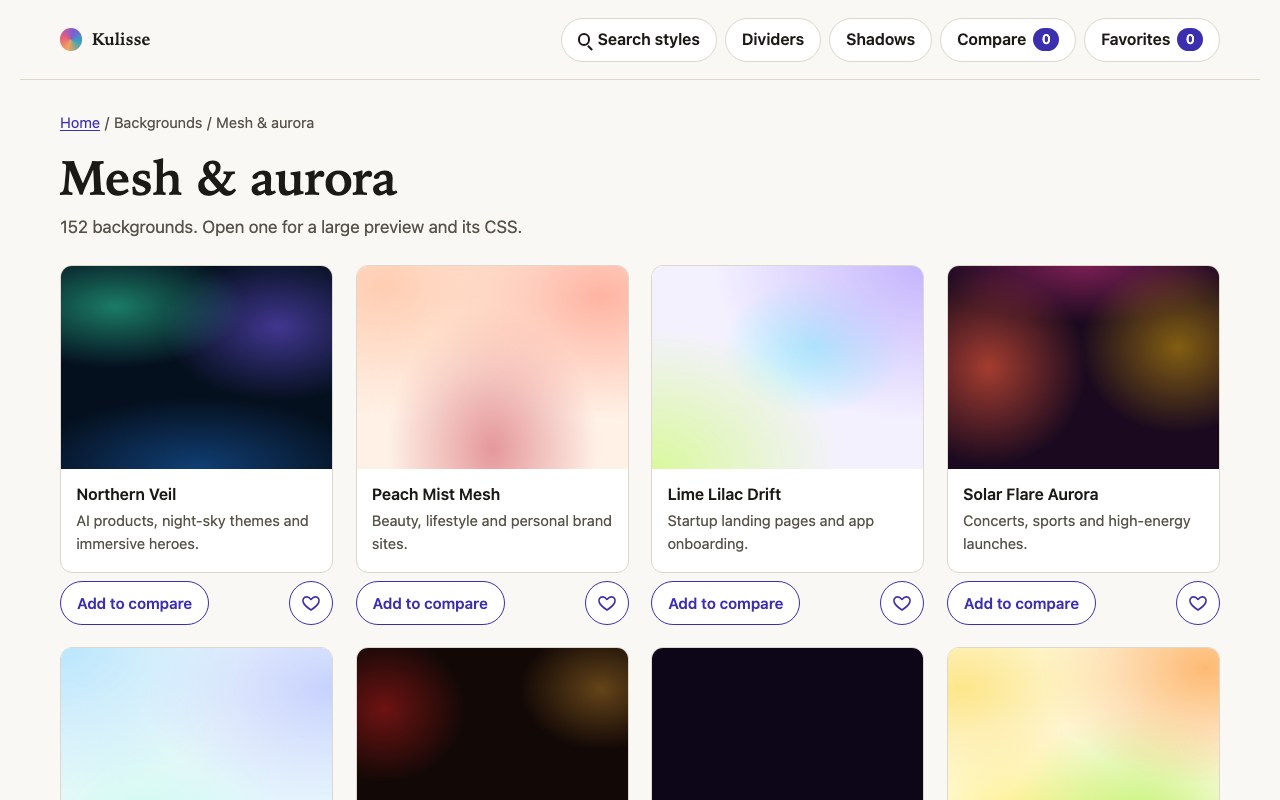
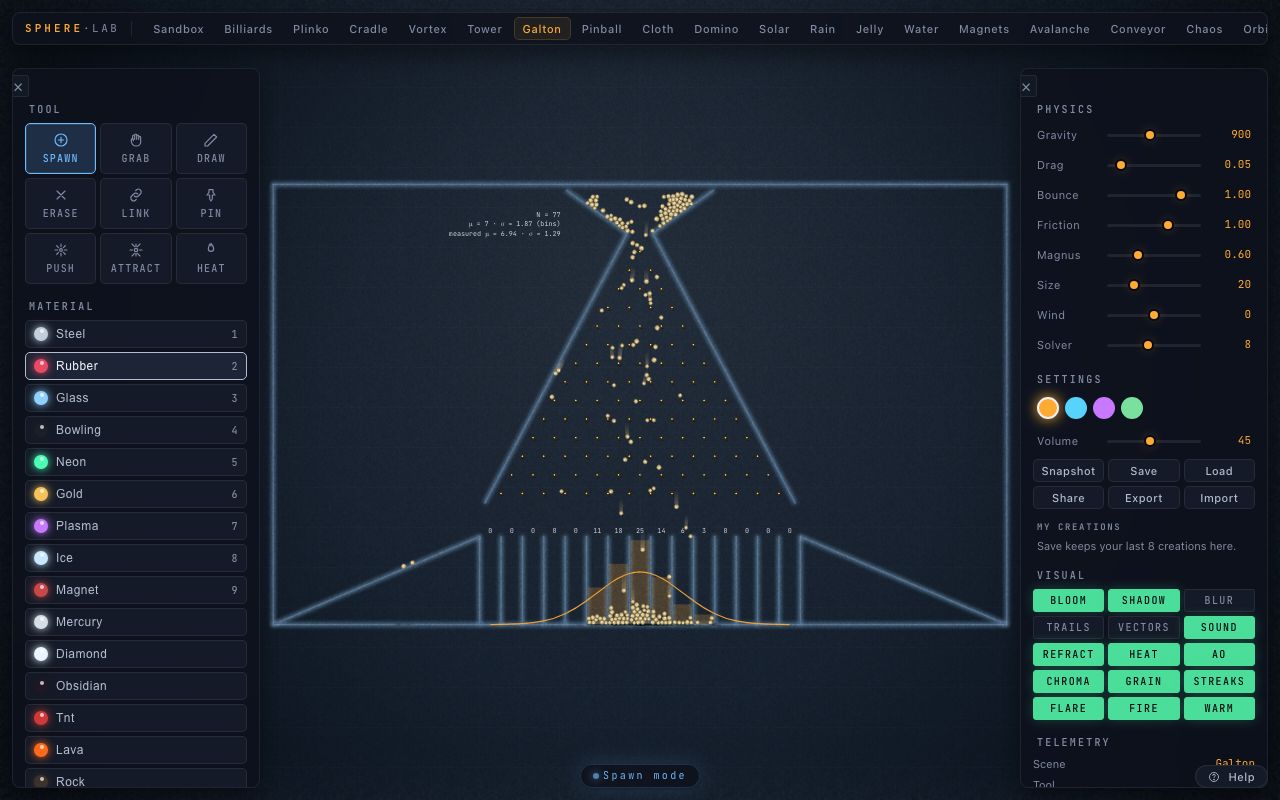
Products we build and keep improving. Their work is part of every figure on this page; client work is counted too, but never named.
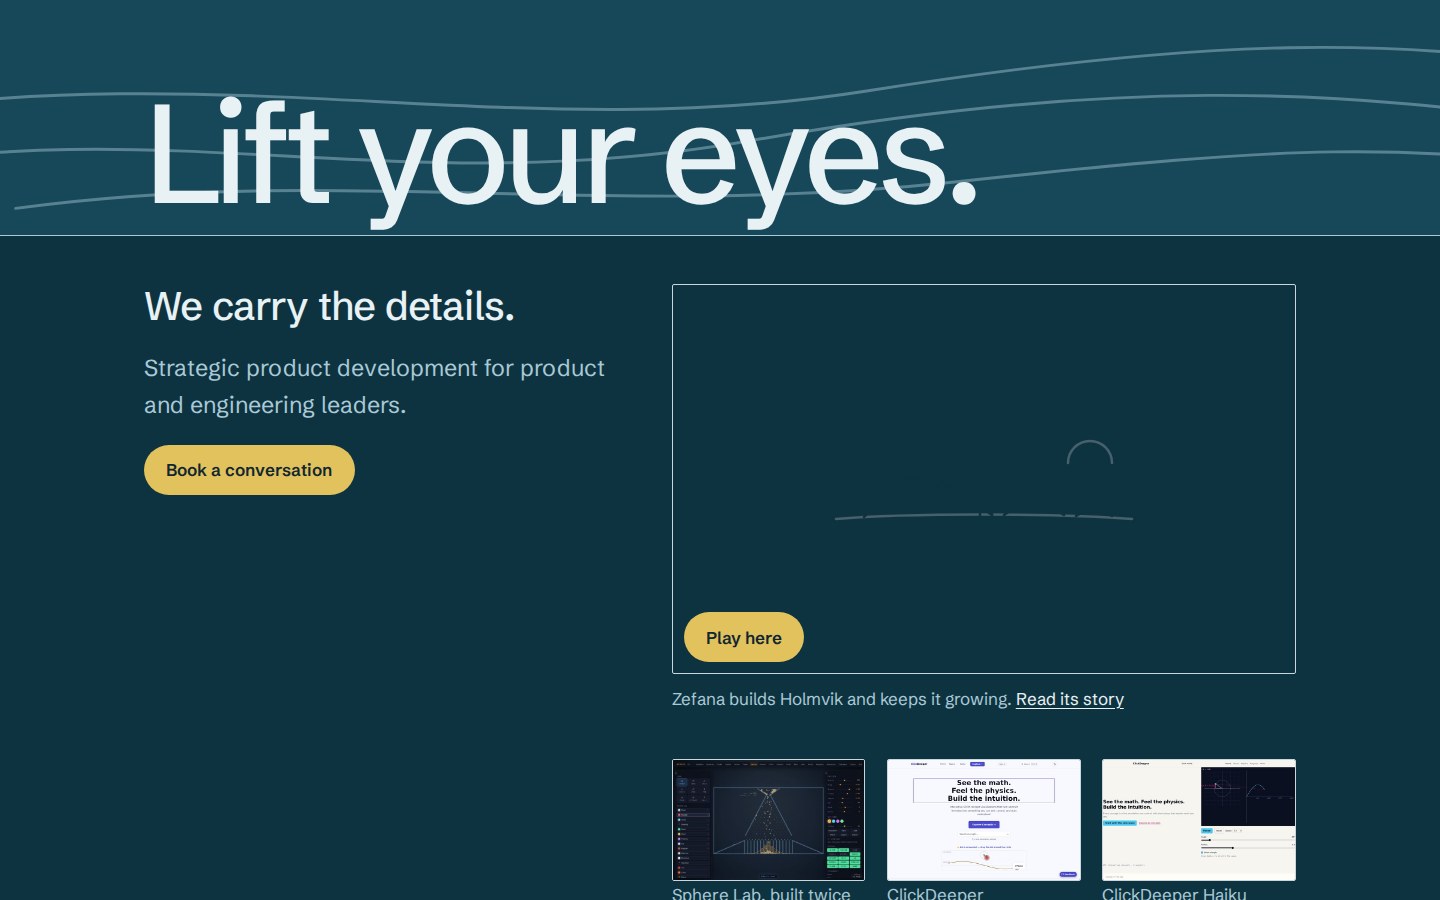
Lift your eyes and let us carry the rest.
Talk to us and see what carrying your product forward looks like.
Prefer to write directly? contact@zefana.com